Calculus functions plotter (Screenshots)
This Windows program will accept any standard function for input and return its graph on a prescribed interval. It will also find its roots and extrema and calculate function values as well. A README file is included which should be read! Platforms include MS-Windows 3.1, 3.1.1, 95, NT 4.0 (all on the same executable).
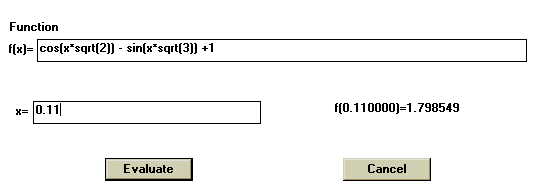
The menu item, Function - > Value, presents one with a dialog box like the one below. This screenshot has for input the quasi-periodic function f(x) = cos(x*sqrt(2)) -sin(x*sqrt(3)) + 1, and evaluates it at the given point x = 0.11. Its value (above the Cancel button) is approximately 1.798549 more than enough accuracy for science and engineering courses.

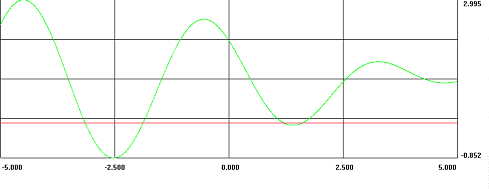
If one inputs the same function f(x) = cos(x*sqrt(2)) -sin(x*sqrt(3)) + 1, into the menu item Function -> New Function window one obtains its graph (over the interval [-5,5], say). You choose the interval ...

The next menu item, Roots -> Interval for Roots gives all the roots of f(x) = cos(x*sqrt(2)) -sin(x*sqrt(3)) + 1, inside the interval [-5,5]. These appear highlighted on the right of the window below. (Compare their values with the graph above)

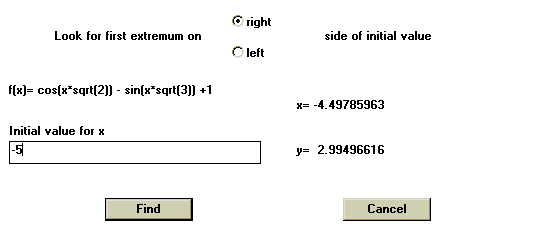
The next menu item, Roots -> Extremum, givesthe first critical point of f(x) = cos(x*sqrt(2)) -sin(x*sqrt(3)) + 1, to the right of x = -5; the This appears as x = -4.49.. with a y-value of 2.99 ... Judging from the graph above, we see that this point gives rise to a local maximum.

Download the Calculus Plotter now!.